Geometry of Roundhand
Analyzing Henry Dean's 1808 Diagram
One morning in 2024, I fell down the rabbit hole of trying to figure out what a diagram from an 1808 writing manual was trying to teach. It's from Henry Dean's Analytical Guide to the Art of Penmanship. I found it reproduced in an old issue of Letter Arts Review (24:4, 2010). It shows a roundhand script with lines drawn across its curves like a loom. Through conversations I had about it on Mastodon (the discussion has since disappeared) with more mathy people than me, it seems to be an elementary explanation of the same idea behind the Bézier curves in Illustrator. However, Bézier's math was formalized roughly 150 years later.
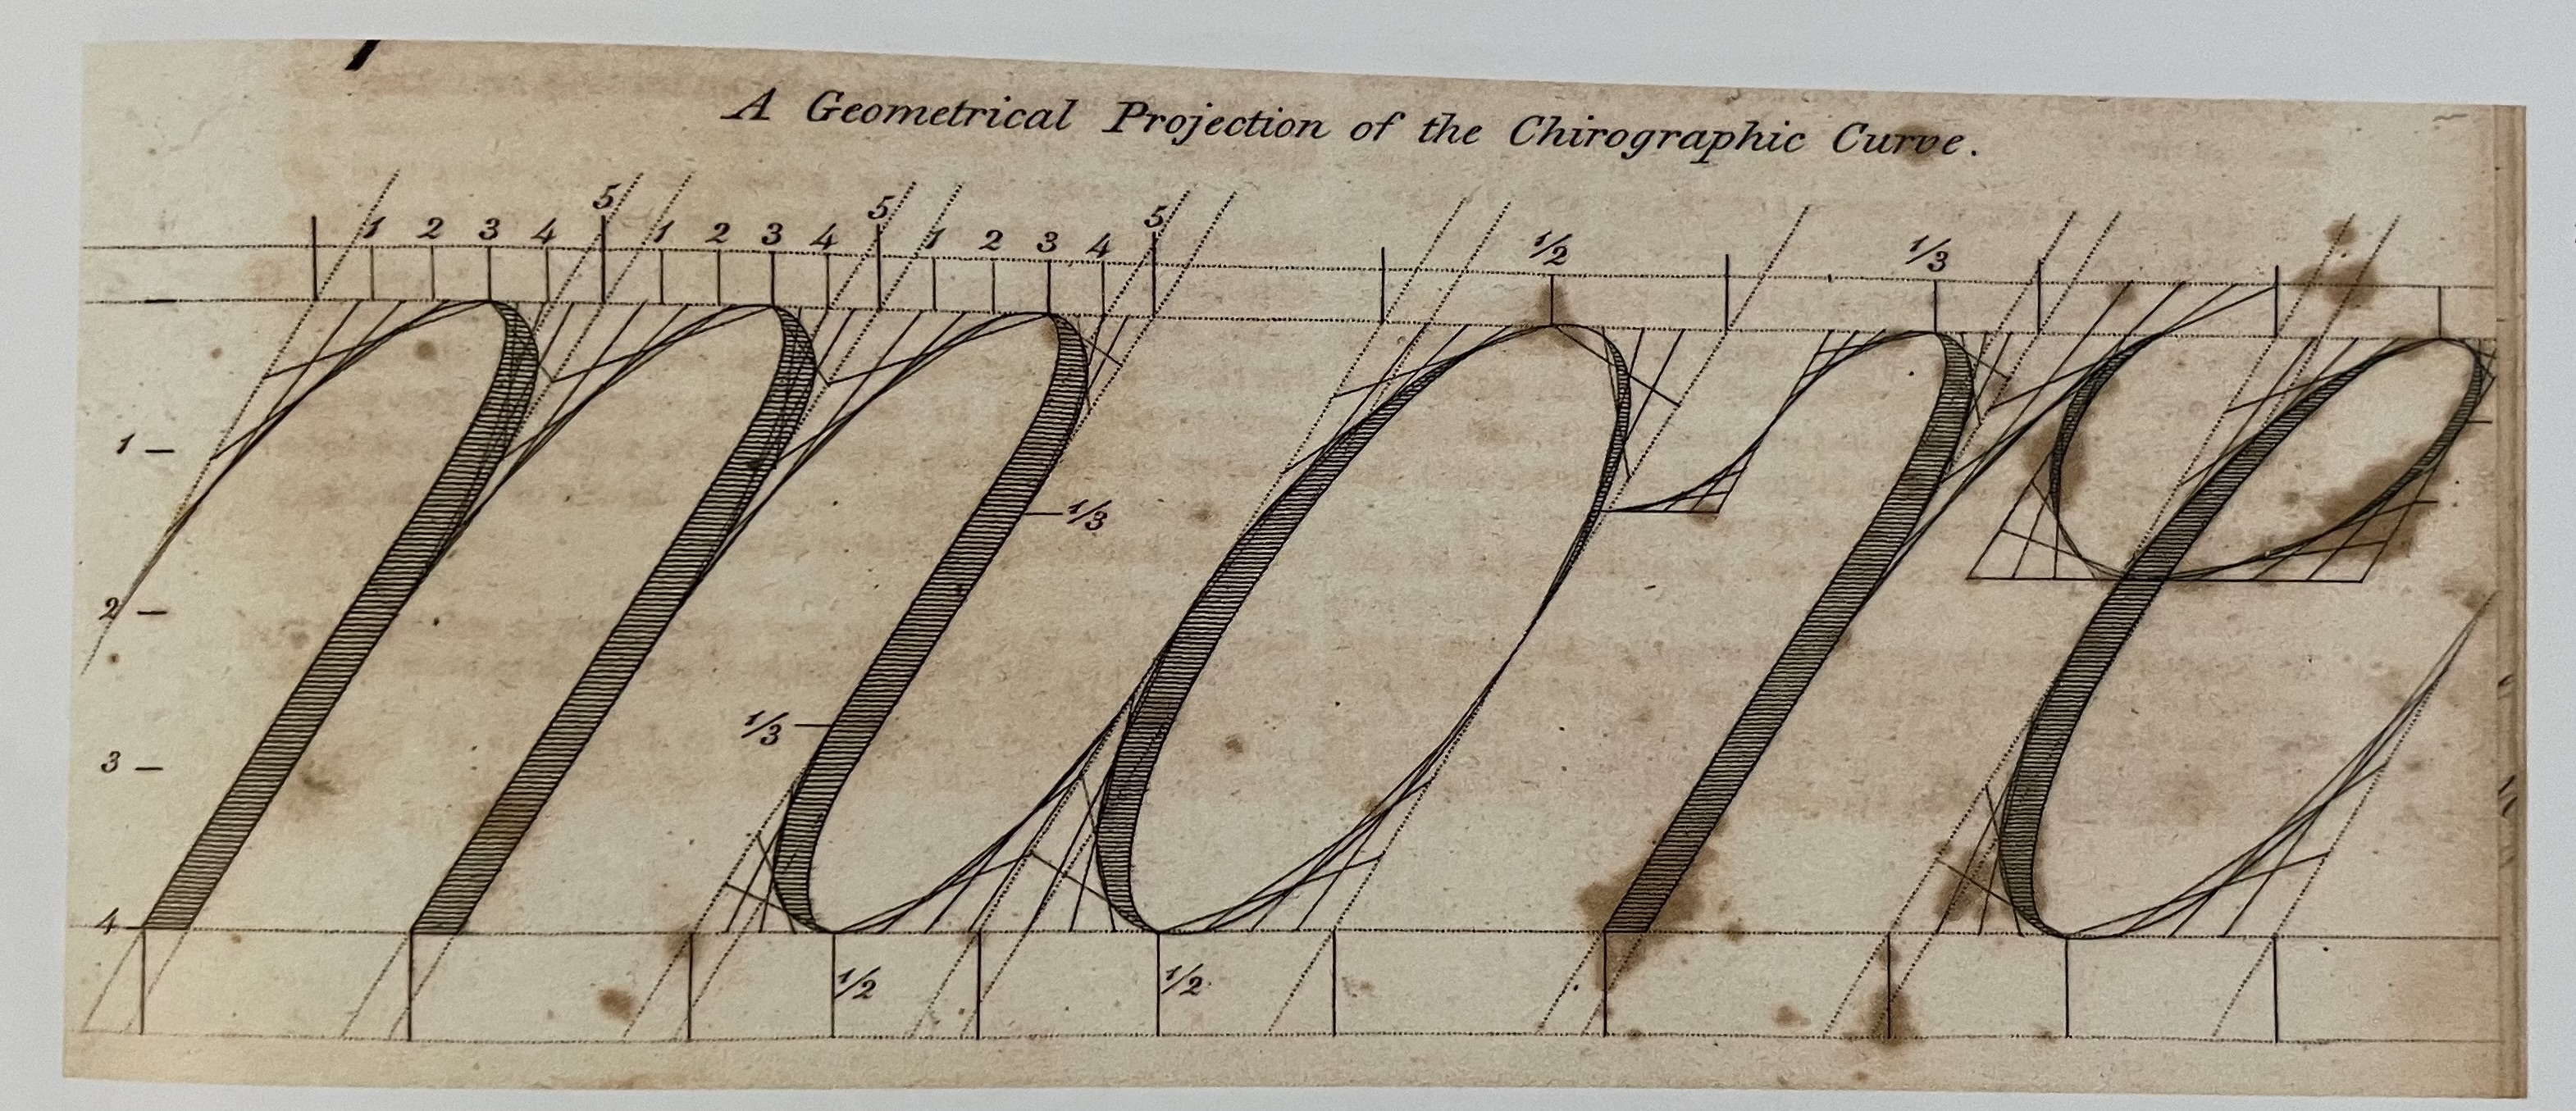
"A Geometrical Projection of the Chirographic Curve," from Henry Dean's Analytical Guide to the Art of Penmanship (New York, 1808). The word is "more." Image from Letter Arts Review 24:4 (2010).
According to Ray Nash in American Penmanship, 1800–1850, Henry Dean was born in Salisbury, Massachusetts in 1788, and was first identified as a writing master in Salem by 1803. He seems to have been full of himself, a bit abrasive, and copied many of his ideas from John Jenkins and Thomas Astle. Even if he wasn't good at citing his sources, he seems to have been a letter nerd extraordinaire! This isn't the only place where he tries to use math to explain letterforms. In Dean's Universal Penman, published a few years later, he tries to geometrically explain the roman capitals.
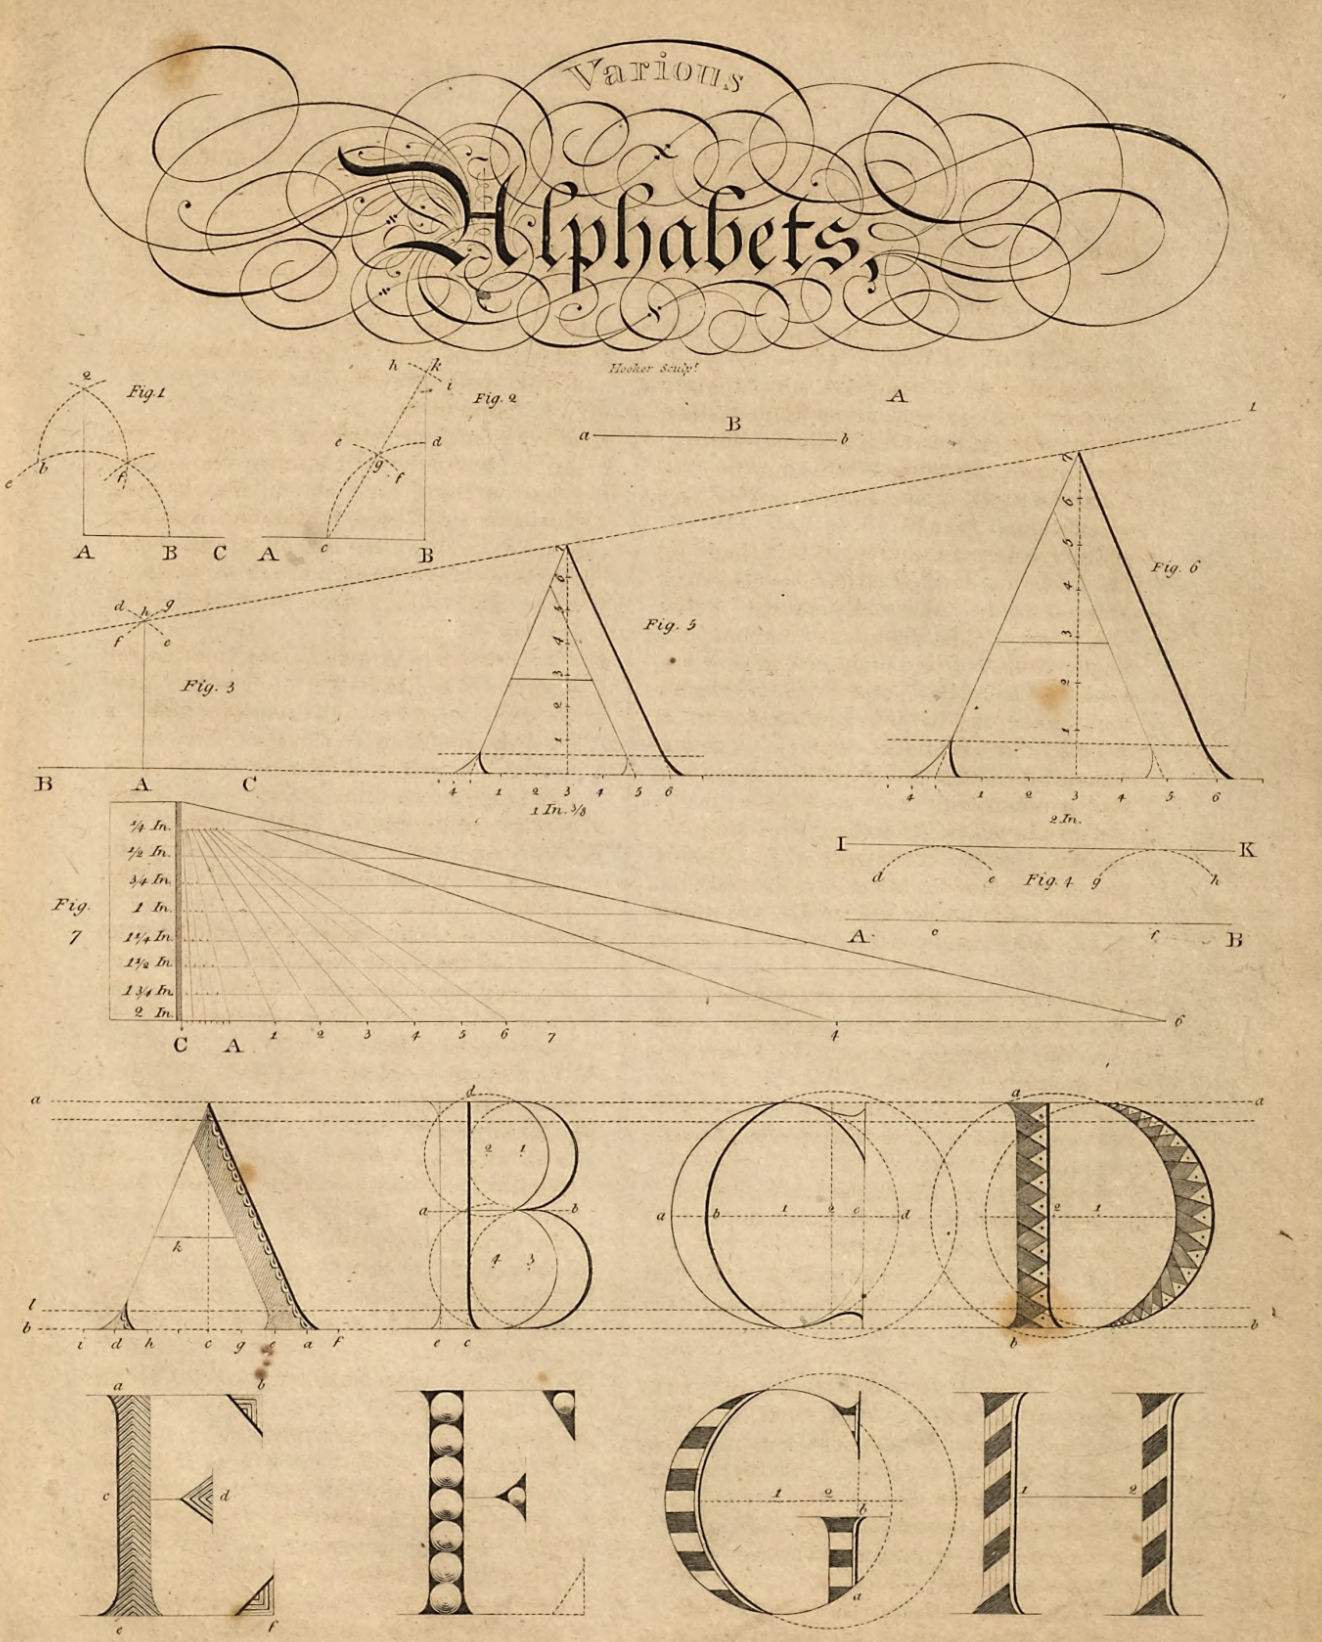
Dean's Universal Penman, image 15. Here he tries to explain the roman capitals geometrically.
So what are we actually looking at in the first image? I'm not sure Dean knew what he was communicating. I don't have access to the original book, so I don't know what he wrote about the diagram. But, I will try to explain what I think is going on. The first two shades are diagrammed incorrectly as it starts plotting from the midpoint, not at the beginning of the curvature—notice that the mesh of lines does align with the curves of the letter. The third shade seems to align, so let's take a look at that one. You have one letter space (from the end of the previous shade to the end of the current) shown along the letter's slant lines. This space is divided into 5. One of these subdivisions equals the width of a shade. Meaning that for his roundhand script, the shade width is 1/5th of a letter space.
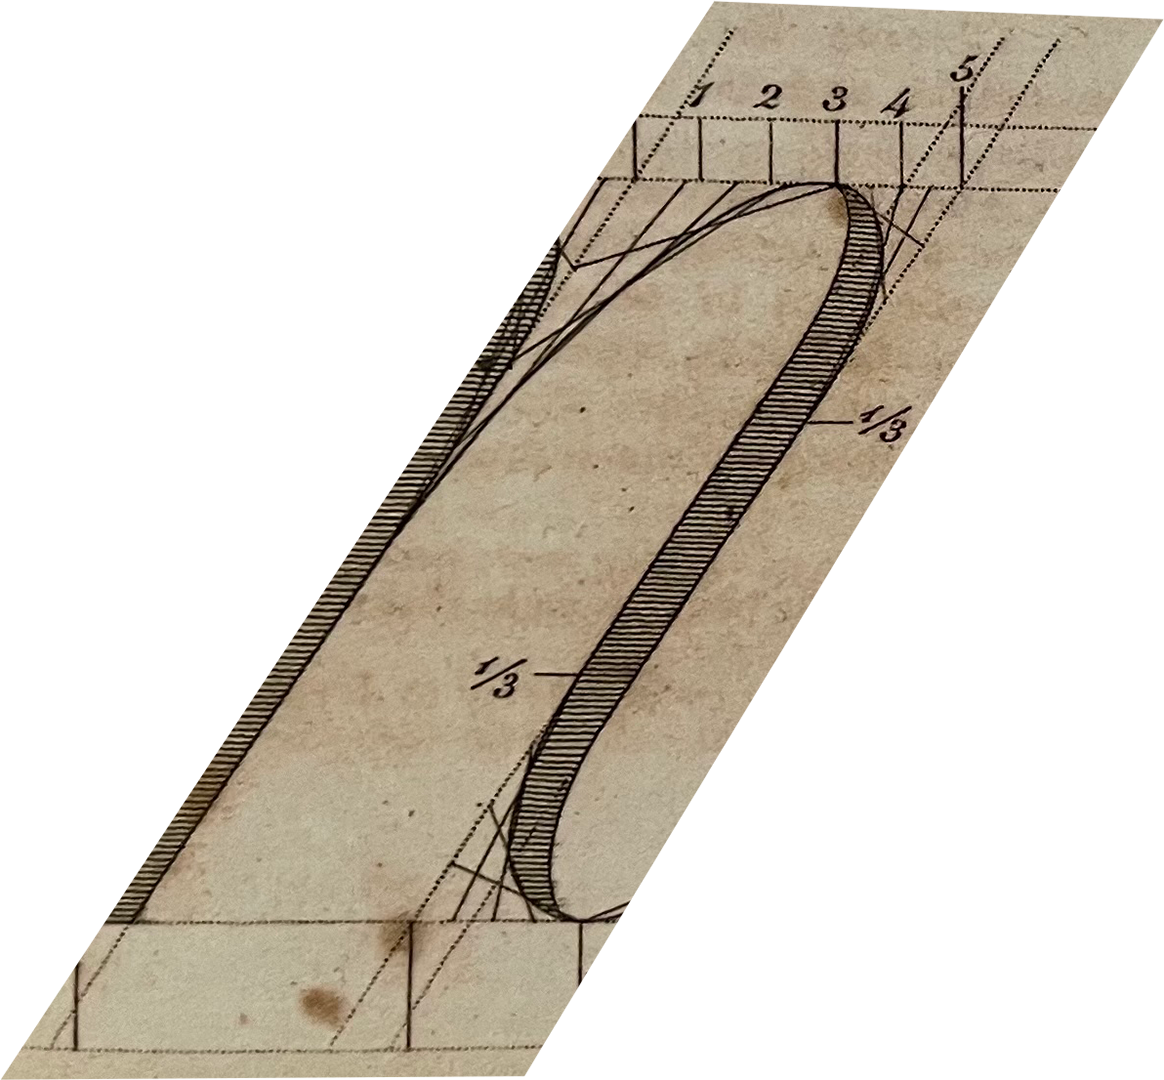
The third stroke of the m in "more." The apex sits at 3 on the waistline, and the curve runs down to the ⅓ mark. Notice that the shade takes up the space between points 4 and 5.
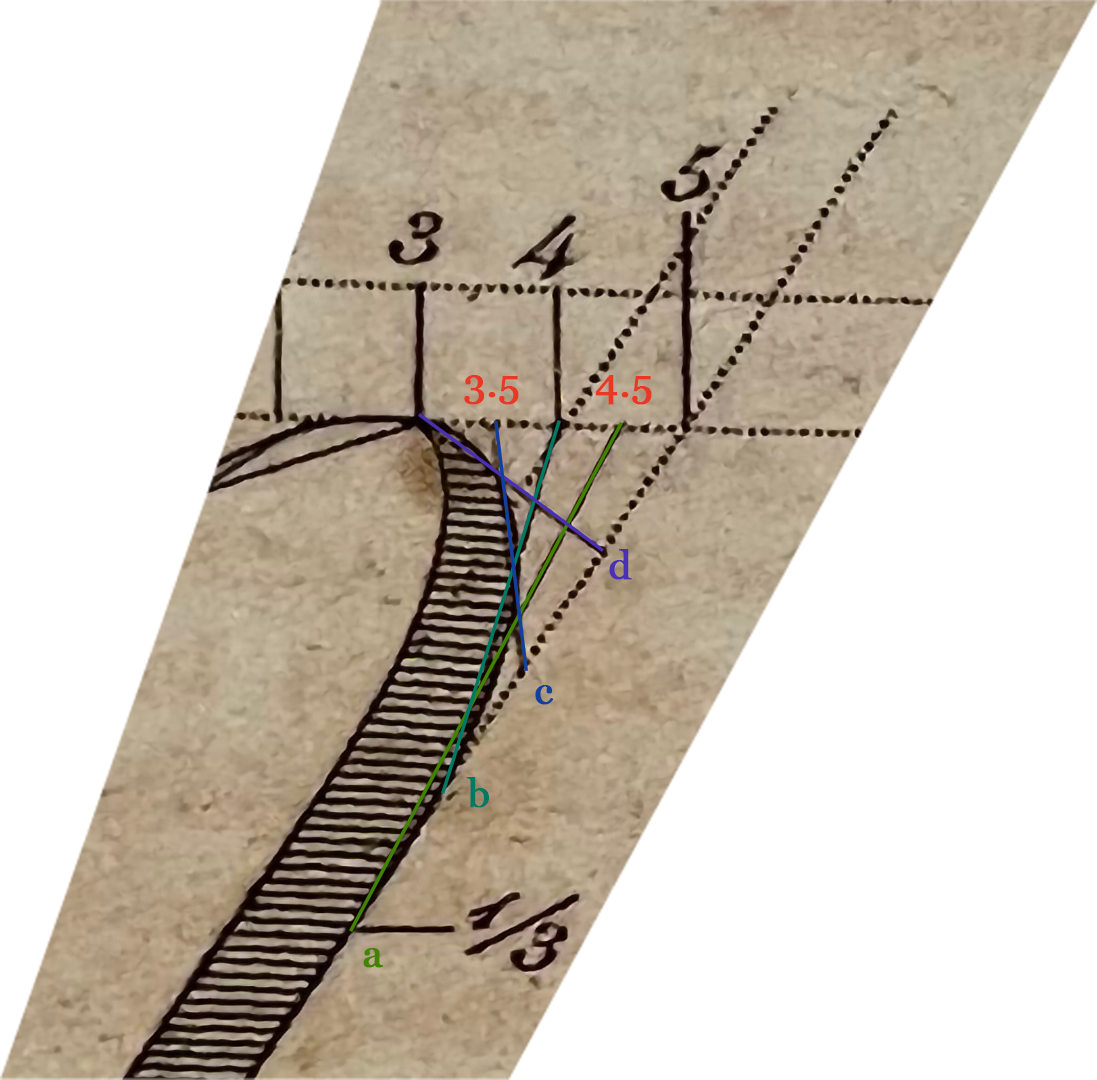
My markup of the same stroke cropped to just the curve. Points 3 to 5 run along the waistline, and a to d run down the slant line. Each colored line is one of Dean's "strings."
Now, plotting the curve. We want to plot half of a curve at a time, since the two halves have different curves. The apex of the curve is at number 3. The curve ends 1/3 of the way down the x-height. We'll want to divide the horizontal and vertical axis into an equal number of parts, in this case 4. Along the waistline, we now have points at 3, 3.5, 4, 4.5, 5 and down the slant line we have d, c, b, a. A textbook projection would connect each point to its corresponding one. However, Dean's pairings are shifted one step from the standard construction. Instead of connecting 3.5 to d, he connects 3 to d, 3.5 to c, 4 to b, and 4.5 to a. This leads to a more angular curve, like the one in this stroke. You will notice all these connection lines are tangents of the curve the stroke. This is envelope geometry. This is the same principle as string art, or curve stitching, a technique Mary Everest Boole invented as a child and later recommended as a way to teach mathematics. It's also the same basic principle that went on to inspire the Bézier curve and eventually the vector curves typographers use today when making digital fonts.
Interestingly enough, going through this 200-year-old diagram has helped explain to me how vector art works. Maybe we should be having all designers do some string art letters in their vector classes! I definitely think it would have helped me with trying to figure out that darned pen tool in Adobe Illustrator.

